
The Early-Stage Visibility System
Two Systems to Escape Chaos Revenue Land

Stuck in chaos revenue land?
You know the feeling. Clients came in. Revenue happened. But nothing compounds. Every new deal adds complexity instead of clarity. You can’t see how this scales.
Everyone says ship harder. So you shipped. And shipped. That’s like trying to fix a million-line codebase vibecoded by your 12-year-old nephew. More code won’t save you.
Here’s what will: a visibility system so simple you can build it this week. And it will change how you make every decision from Monday forward.
Forget Everything Series B Companies Told You
Most startup advice comes from companies with traction, historical data, and predictable revenue. You don’t have that yet.
OKRs were designed for companies that can forecast quarters ahead. You’re iterating weekly. Dashboards with 47 metrics create the illusion of control. You need 2-3 that actually matter. Quarterly planning assumes stability. You’re still figuring out who your customer is.
You can’t build a 12-month roadmap if you can’t predict next month’s revenue.
“Data-driven” at early stage often means paralyzed by incomplete information. Or worse, optimizing metrics that don’t connect to your actual mission.
Early stage needs a different operating system. Two systems, specifically.
System 1: The Learning Engine
Visibility is not a dashboard. It’s a map.
Without it, you’re driving with blacked-out windows. Making turns based on gut feel. Hoping you’re headed somewhere good.
The map answers one question: Are we moving toward our Ideal Customer Profile (ICP) and mission, or away from it?
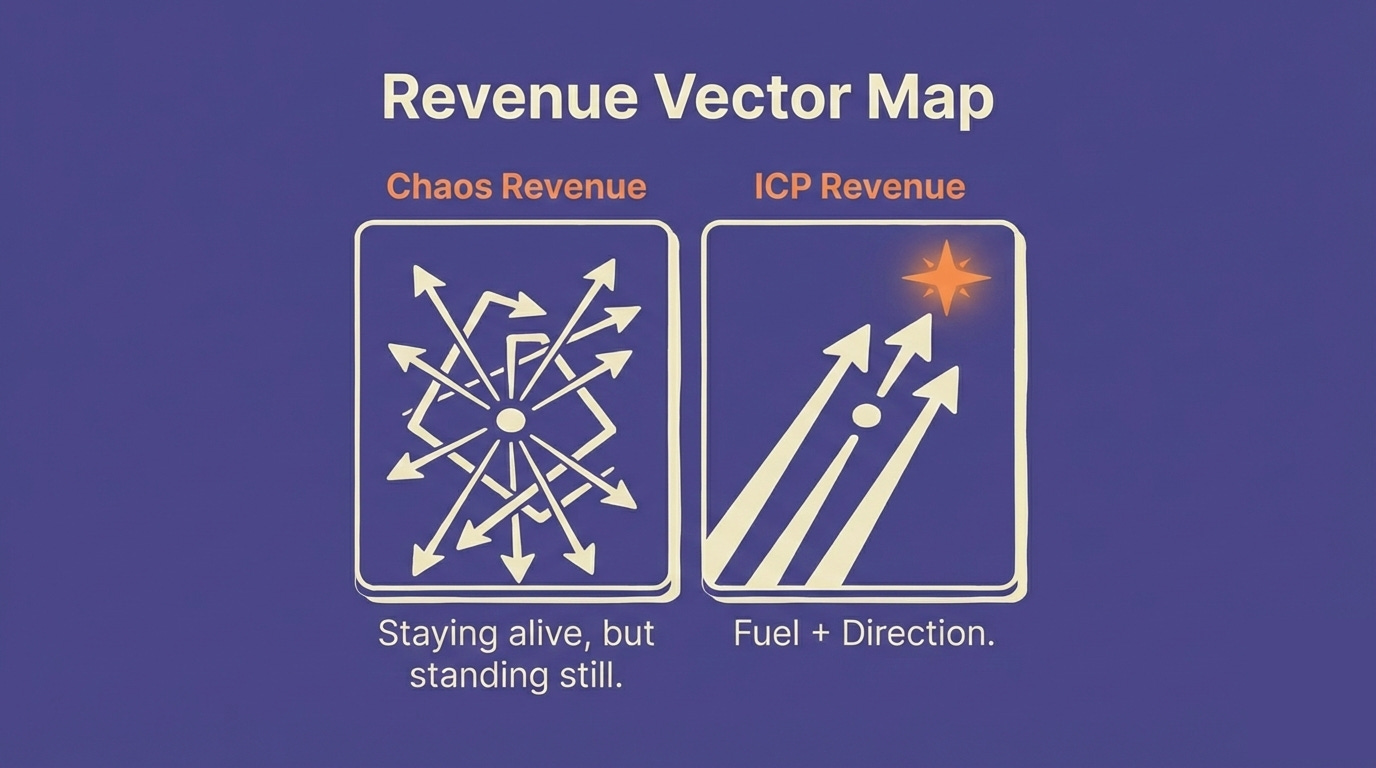
Revenue Is Fuel. Not Always Direction.
This is the trap most founders miss.
Revenue keeps you alive. That’s its job. But not all revenue points you toward your destination.
Some revenue confirms you’re on the right path. The client fits your ICP. The work compounds into something repeatable. You learn something that makes the next deal easier.
Other revenue just funds you going sideways. The client doesn’t fit. The work is custom. You survive another month but learn nothing about your actual business.
Chaos revenue is fuel without direction. You stay alive while drifting further from where you need to go.
Your 2-3 Metrics Are Hypothesis Tests
Stop thinking about metrics as scorecards. Think about them as experiments.
Frame it this way: If our ICP and mission assumptions are correct, what numbers should move?
If they move, your assumption is validated. Double down.
If they don’t move, your assumption is wrong. Adjust before you burn more runway.
You don’t need 47 metrics. You need 2-3 that connect directly to your core hypothesis about who you serve and why.
Yes, you can build a Metabase instance with multiple views. Stacked bar charts showing WoW and MoM trends. A 12-month view to see the bigger picture. But start with the 2-3 numbers that actually tell you if you’re winning or losing. Everything else is context.
The WoW/MoM Rhythm
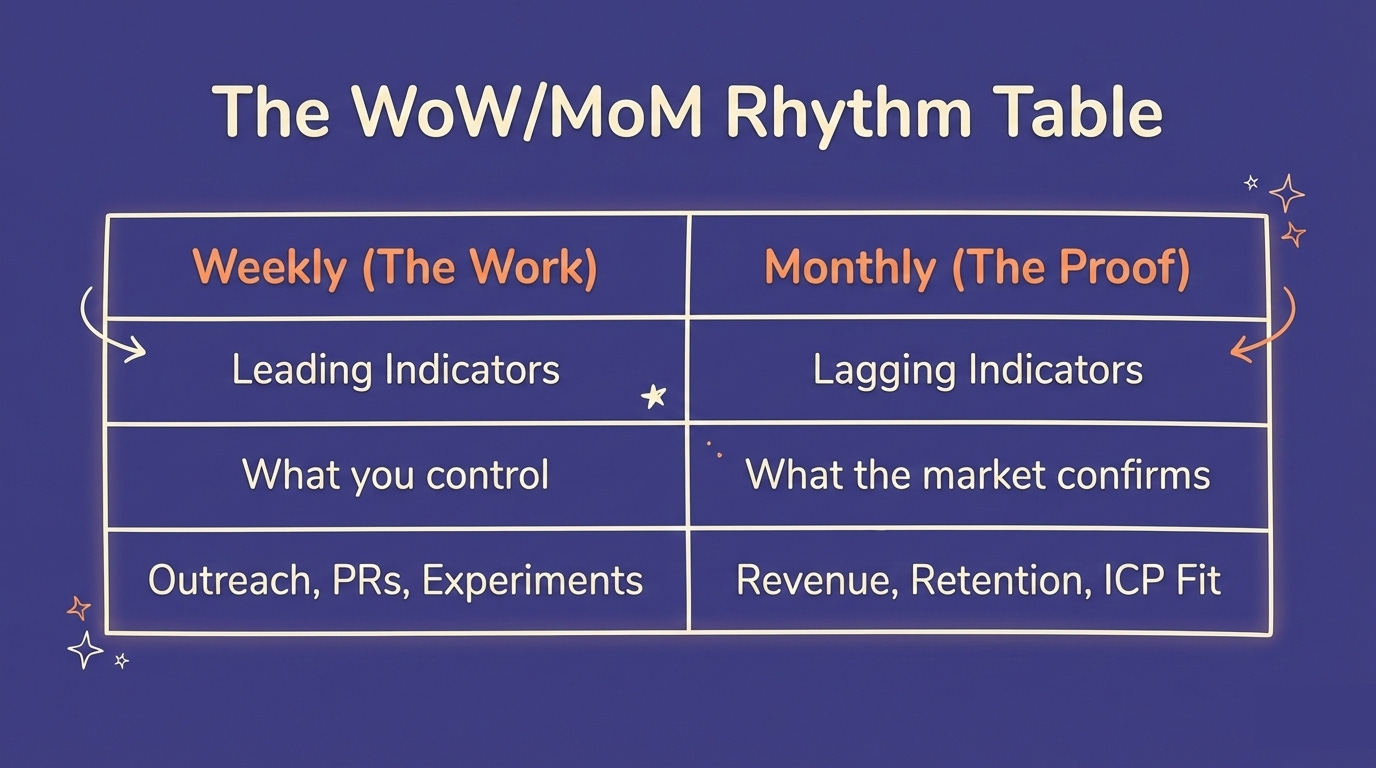
Weekly for inputs. What you control. Calls made, experiments run, features shipped.
Monthly for outputs. What confirms the system works. Revenue, retention, adoption patterns.
Not daily. That’s noise. Not quarterly. That’s too slow to course-correct.
Name your indicators clearly:
Leading indicators are inputs. You control them. Volume of outreach, user conversations, PRs merged, experiments launched.
Lagging indicators are outputs. They confirm whether your inputs are working. Revenue closed, users retained, ICP clients acquired.
At early stage, track mostly leading indicators. Lagging comes when you have enough volume to see patterns.
System 2: The Decision Engine
Visibility without shared interpretation is just numbers on a screen.
System 2 is how your team turns signal into aligned action.
The Shared Language Problem
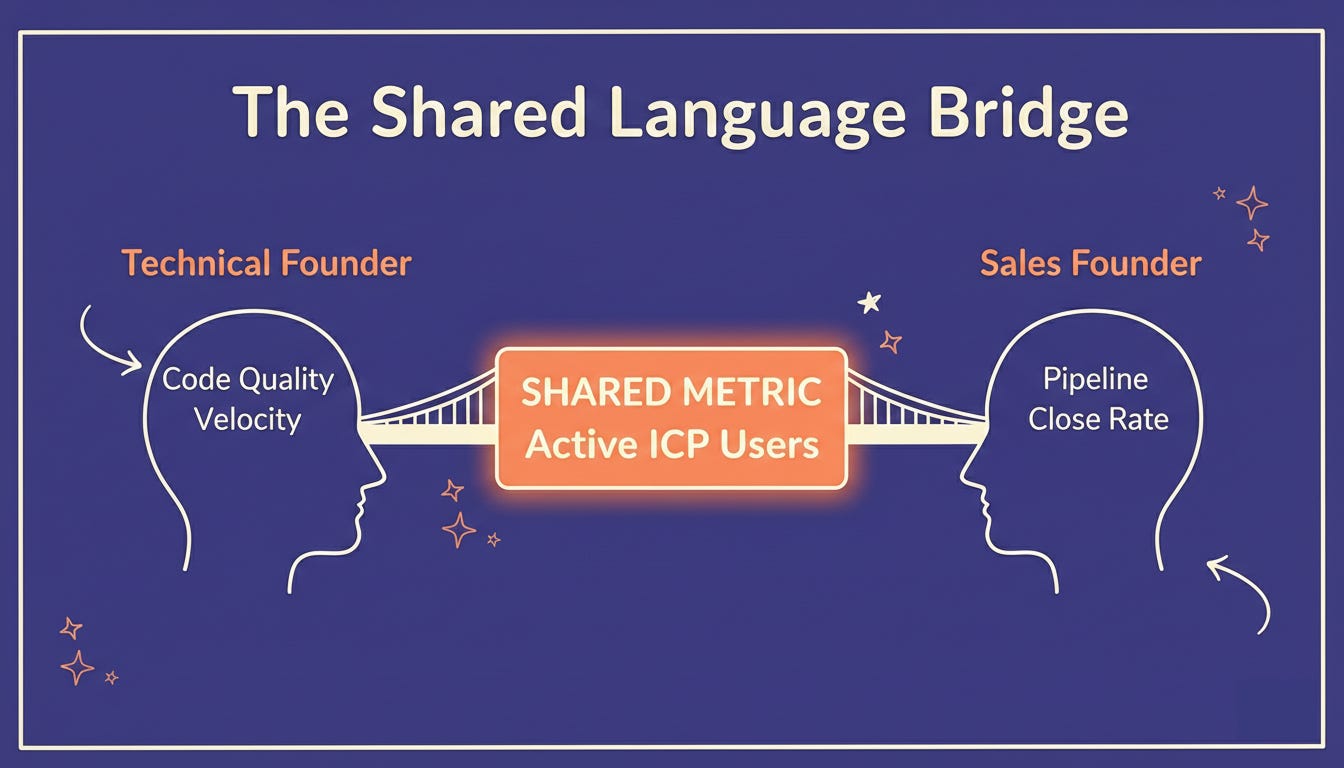
Co-founders use the same words but mean different things.
“We’re doing well” means something different to a technical founder than a sales founder. One is thinking about code quality. The other is thinking about pipeline.
Without shared metrics, every conversation becomes a translation exercise. Or worse, a political negotiation about whose perspective is right.
Shared metrics create shared language. Now “doing well” has a number attached. You can agree or disagree about strategy, but you’re at least looking at the same map.
Accountability Through Inputs
Here’s the uncomfortable truth about early stage: outputs are uncertain. That’s the nature of the game.
You can’t hold someone accountable for revenue they can’t fully control yet. The market is still being figured out. The product is still being shaped. The sales motion is still being discovered.
But you can hold them accountable for inputs.
Calls made. Experiments run. Builds shipped. Conversations logged.
This builds trust in a low-data environment. “I can’t show you results yet, but I can show you the work. I can show you that I’m testing hypotheses, learning fast, and adjusting.”
When outputs eventually arrive, you’ll know exactly which inputs drove them.
Transparency Kills Politics
When everyone sees the same map, opinions lose power.
No more “I feel like engineering is slow” versus “I feel like sales isn’t closing.” No more debates based on vibes and incomplete information.
The numbers arbitrate. Not perfectly. But fairly.
Everyone sees what everyone else is accountable for. Leadership syncs become about problem-solving, not positioning. Resources get allocated based on what the map shows, not who argues loudest.
Fair. Simple. Honest.
When Learning Meets Deciding
System 1 gives you signal.
System 2 turns signal into aligned action.
Aligned action generates better signal.
The loop compounds.
The Stress Test
Here’s how you know if your systems are working:
When inputs grow, systems get stressed. That’s expected. More volume means more pressure.
If outputs scale with inputs, you have a multiplier. Your systems are working. Keep going.
If outputs stall while inputs grow, something is breaking. Fix it before you scale further. More inputs into a broken system just creates more chaos.
The Destination
The exit from early stage is not a revenue number.
It’s 5 real ICP clients on retainers at market pricing (might be something different to you, but this milestone must exist and be specific).
Why 5? Because 5 clients force you to build real foundations. Delivery systems that don’t depend on heroics. Team systems that don’t depend on one person knowing everything. Processes that are repeatable.
When you have those 5 clients, you’ve validated something important: your blueprint works. The learning engine found something real. The decision engine kept you aligned long enough to get there.
Next phase unlocked. Congrats. What’s next? 5M? 10M? 100M? 1B?
Start Monday
Three things to do this week:
1. Schedule the Sync
Weekly. 30 minutes. Co-founders and leads only.
Structure it as a roundtable, not a monologue. Each person gets equal speaking time. Fast updates: inputs from last week, outputs observed, learnings, plan for next week.
Record the meetings. Save the accountability notes in a shared place everyone can access. This becomes your institutional memory.
Put it on the calendar today.
2. Pick Your Metrics
Two levels:
Company level: 2-3 metrics that answer “Are we moving toward ICP and mission?” These are the numbers everyone looks at together.
Leader level: 2-3 metrics per function that roll up to the company metrics. Could be 1, could be 5, depending on your business.
Sales examples: revenue generated, deals signed, calls scheduled, outreach volume, follow-up rate.
Product examples: engineering velocity, product unlocks shipped, user behavior data, learnings from experiments.
Write them down. Make them visible.
3. Start the Doc
One page. Shared.
This week’s metrics. What you learned. What you’re doing next week.
Each leader contributes their section before the sync. Everyone reads it before the meeting. The meeting becomes about discussion, not status updates.
That’s the system.
Simple enough to start today. Powerful enough to get you out of chaos revenue land.
Appendix: Starter Metrics by Department
Engineering: PRs shipped, build cycle time, rework versus new work ratio
Product: Users completing target action WoW, feature adoption rates, learnings logged
Sales: Outreach volume, calls booked, deals in pipeline, revenue closed
Marketing: Leads generated, ICP fit percentage, channel performance
Customer Success: Active accounts, conversations logged, expansion signals
Operations: Systems implemented, process cycle times, bottlenecks identified
Pick 1-3 per function. Adapt to your context. Start simple. Add complexity only when you’ll actually use the additional signal.
This is Part 2 of the Early-Stage Operating System series. Part 1 covered the 5 Strategic Accounts milestone.